Quick answer: The average car is a silver, automatic, 2.3 Liter 2008 Toyota Corolla with 107,813 km and is valued at $16,122
Well sort of. The title to this post and that quick answer is a bit of a lie. A more accurate title may be “What cars do Kiwis no longer want to drive?” Using the methods in my last post, Learning Python – Project 2: How to find the best price on TradeMe, I’ve amassed a data set of 60,074 unique car listings over the past 2 months or so. I’ve done my best to clear out any duplicates but no promises that this data is perfect. That being said, I had a lot of fun playing around with it and looking for trends. Anyways, enough with the words, onto the data and my non-expert speculations on what it means.
A bit of cleaning up
Aside from taking out duplicates, I opted to take out incomplete listings as well to make things easier. I also did a bit of filtering for weird data entries, like cars with an engine size of just 1. Since TradeMe is a bidding site there are also some cars listed at $0, those are out. For the sake of cleaner (and ultimately more informative) plots, I took out really old cars (there’s a 1924 Chevy Superior for sale if you’re interested), really expensive cars ($710,000; it was a 2014 Aventador, the listing is gone now), massive engine vehicles (probably an entry error, but your BMW X5 does not have a 44,000cc engine bud). Anyways, just for clarity, I did some cleaning. We’re down to a still respectable 53,176 data points.
Filters:
Price > $1,000 && < $100,000
Year > 1980
Odometer > 100 && < 400,000 kms (For American readers, 100,000 km is roughly 60,000 miles)
Engine Size > 500 && < 6,000 cc
| Start Price (NZD) | Year | Odometer (kms) | Engine Size (cc) | |
|---|---|---|---|---|
| Mean ± STD | $16,122 ± 14,14648 | 2007.8 ± 5.96 | 107,813 ± 72,073 | 2,318 ± 850 |
| Median | $10,995 | 2008 | 94,143 | 2000 |
Distribution checks

Giving a once over to our data using a simple histogram is always useful. Histograms just take all our data, sort them into bin ranges (e,g, $0-$4,000 is one bin, $4000-$8000 is the next bin) then counting how many listings fall into these bins. We can see a vast majority of cars for sale are less than $20,000 with a peak around $10,000. There’s another little tick-up in listings around $30,000, possibly capturing all the $29,999 cars.
 The distribution of car year was quite interesting with the massive peak around 2007. Seeing as it’s 2018 now, perhaps people buy new cars and sell them after 10 years. Or, people feel comfortable with buying a car around 10 years old, but anything more is risky. Or cars only live about 10-15 years before repair bills total the car’s worth. Probably a bit of all three and other factors I haven’t thought of.

Wow, that’s a nice distribution. I wish my neurological data could be so nice. Quite the pile up just before and at the 100k mark. This may be an attempt to sell the car before it hits the 6 digit mark.
Relationships
Let’s dive a bit further into these data. We’ll start with a correlation matrix to see how our numerical data relate to one another. Engine size isn’t strongly related to the other factors, though there is a modest correlation to price (0.27). Year and price (0.63) and year to odometer (-0.64) have the strongest relationships.

The below plots were pretty difficult to make with the large number of data points. Each listings is a very tiny dot with a very low alpha value (intensity, more or less). More dots that cluster together, the darker the area becomes. These plots almost serve as a heat map as well, showing the density of data points in areas of a graph.


For some reason, some cars built around 1995 retain their value quite well*. Kiwis drive there cars about 16,666 km per year. Additionally, every 10 kms decreases a cars value by $1.00.
*Update 05/05/2018: u/zemudkram pointed out on Reddit that big SUVs that could not be imported previously can now be imported as collectibles which may be causing that bump. The jump in average price really occurs in 1996 and 1997. I dove deeper and sure enough, the most expensive cars in that bump is Land Cruisers, Prados, and Surf’s. The number of listings for these big SUVs drops off significantly in 2000. Furthermore, the average price in 96-97 ($6,713) is significantly higher than in 00-01 ($5,151; p < 0.0001). Also in there are a lot of large engine (5L+) Utes like dodge Rams and performance cars like Skylines and RX7’s contributing to that bump in 96-97.
Enough with numbers for now, what else can we learn about Kiwi car preferences.
Car Details

Kiwi’s certainly like their 5th door; hatchbacks have a substantial lead over sedans, and that’s keeping hatchbacks and wagons separate! At the other end, NZ’s wet weather and rugged roads (at least in the south island), make convertibles and coupes unpopular. For American readers, Utes are pickup trucks.
![]() Automatic is king, shaking off their UK overlord’s preference for manuals.
Automatic is king, shaking off their UK overlord’s preference for manuals.

No real surprises here. Color names start to get weird and ambiguous at the lower end so I cut it off at green.

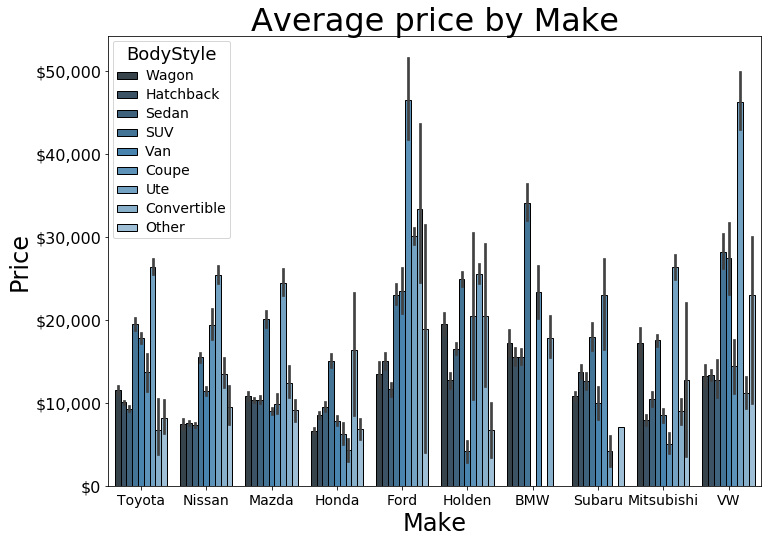
Wow! Toyota’s take it hands down as the favorite (or least favorite? These are cars for sale after all). Holden is the AUS/NZ General Motors subsidiary. Some models are the same as in the US while others are unique.

The first thing that struck me was the average premium for a Western brand to an Eastern brand is quite drastic. The average Asian make is $12,578 while the average Western make is $19,396. One possibility is that Western cars are not necessarily more expensive, but their body styles make them more on average more expensive, e.g. more SUVs than Sedans. I went on to break this down a bit further, as far as I dare without making cluttered graphs. Thus, I broke this plot into body style, though in my own categories.
Small: Hatchbacks, Sedans, Coupes, Convertibles
Medium: Wagon
Large: Van, SUV, Ute

May not be the greatest groupings, but plotting all the body styles individually looks terrible. Anyways, I think these groupings capture the point; when comparing apples to apples, all Western cars, small, medium or large, still command a premium to Eastern brands.
| East | West | |
|---|---|---|
| Year | 2007 | 2009 |
| Odometer (kms) | 114,983 | 108,317 |
| Engine Size (cc) | 2,171 | 2,696 |
I dove more into the data for why this may be. Not only may there by a premium for Western car brands, but Western cars also tend to be newer, have slightly fewer kilometers on them, and contain larger engines. All of these differences contribute to a higher price. Also Hondas are just really cheap.

Well this is pretty interesting. To no ones surprise we have the Toyota Corolla in first. but in a very close second is the Suzuki Swift. Suzuki didn’t even make it in to our top 10 car makers. Turns out Swifts are just insanely popular (or unpopular). Of the 1,742 Suzuki’s, Swifts make up 1,162 of them, with the SX4 in a far second at 128.
That’s about all the ideas I have for looking into this data. If there’s anything you’d like me to checkout leave it in the comments below.
All of this was made with Python using Pandas for data organization and matplotlib and seaborn for the graphs.

This work by Blake Porter is licensed under a Creative Commons Attribution-Non Commercial-ShareAlike 4.0 International License
Leave a Reply